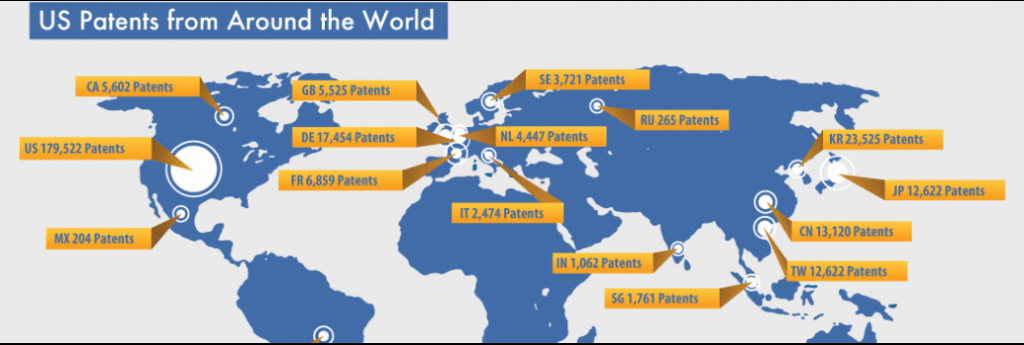
Now that 2017 is over, it is a good time to take a brief look at the overall US patenting statistics for the year as identified in AcclaimIP.
In 2017, there were 352,585 granted patents, which is an increase of 5.4 % over 2016. This reverses a trend we had seen over the previous three years where grants were essentially flat. However, there were also 374,731 U.S. applications published in 2017, which is over 7,000 fewer than 2016.
So while there was a jump in 2017 in grants, the slowing trend continues for applications, as it has for the past few years. The numbers indicate, therefore, that the USPTO has reduced its backlog, and the trend towards fewer applications being published could be seen in future years in a reduced number of patents.
As noted last year, a contributing factor to the decline in the number of applications is patent owners are getting smarter and doing a better job of filing patent applications that are more useful. These applications better align with their strategy assuring that patent portfolios do their job of protecting their products and roadmap, or providing defensive use, and/or can making money via licensing, sales, and enforcement.
When you look at who is getting patents, the top grantees are driving the market. In fact, the top 25 patentees this year received over 65,000 patents or more than 18% of all patents granted by the USPTO. And they were led by IBM, a perennial innovator, with over 9,000 patents granted. This is the first time any patentee has cracked the 9,000 patent barrier. Since 1992, IBM has received more than 1% of all patents ever granted by the USPTO, a testament to their focus on R&D and innovation.
While computing and data processing continue to be the leading patented technologies, it is interesting to note that there have been advances in other classes as well, such as tools and hardware, furnishings, and food and drink preparation. Innovation occurs across the board, not just in high tech and bio tech.
The most interesting trend to watch over the next few years will be what happens with new applications. If the downward slide continues, is this due to smarter filing strategies, or is it a larger issue with less emphasis put on patents? Only time will tell, but what we identified last year still seems to hold true –patentees are making more informed filing and renewal decisions backed by insights gained from “big data” analytics. Organizational focus will be on smaller, higher quality patent portfolios to better protect products, provide a good defensive stance, and monetize potential via sales and licensing.
Highlights of the infographic include:
- Quantity of Patents Granted
- Annual Patenting Trends
- Top Patent Agents & Firms
- Top Inventors & Patentees
Top 10 things that stood out in 2017:
- 381 Claims -Number of Claims in patent US9801712 by WL Gore & Assoc
- 12,348 Words- Number of words in Claim 1 in patent US9725453
- 11,493 Days- Filed in 1986, US9702669 took over 30 years to grant
- 121 Applications- Forward Rejections caused by patent US9820658 (it also impacted 82 assignees)
- 588 Documents- Largest file wrapper by number of documents is patent US9773877
- 538 Members- Largest patent family in 2017, by Angle North America Inc.
- 1,085,318 Words- Number of words in patent US9585906 (about twice as long as War and Peace)
- 53 Inventors- Number of Inventors Intralinks named on patent US9613190
- 35 Applications- Novelty (§102) rejections by patent US9846323
- 4,342 Days- Longest delay before first Office Action for patent US9814559
